
Inflation Calculator – U.S. Dollar Value from 1913 to 2026
See how the purchasing power of the U.S. dollar has changed over more than a century. This calculator lets you convert any amount
from 1913 (the first year of official CPI tracking) to today — and up to a projected 2026 value —
using Bureau of Labor Statistics (CPI-U) data. Instantly compare buying power, total price change, and the
average annual inflation rate (CAGR).
- Enter an amount, choose From year and To year (1913–2026), then click Calculate.
- Toggle the reverse option to treat your amount as “today” and convert it back to earlier years.
- Results show price change, multiplier, and average annual inflation based on CPI-U.
📌 Data note: Historical values come from BLS CPI-U. The 2026 figure uses a prudent projection and will be
updated after official BLS releases.
Keywords: inflation calculator, US inflation calculator, inflation by year, inflation calculator USD, money inflation calculator, CPI inflation rate
U.S. Inflation Calculator (CPI-U)
Convert purchasing power between years using the U.S. CPI-U (1982–84=100). Supports both directions: “then → today” and “today → then.” USD only. Educational estimate.
Convert Amount
What Is Inflation and Why It Matters
Inflation is the rate at which prices rise over time — and as prices rise, the purchasing power of your money falls.
In other words, each dollar buys a little less each year.
For perspective, $100 in 1913 has roughly the same buying power as about $3,100 today — more than
30× higher prices across a century of U.S. economic history.
The U.S. Bureau of Labor Statistics (BLS) measures inflation using the
Consumer Price Index for All Urban Consumers (CPI-U), a widely used benchmark for wages, contracts, taxes, and
financial planning.
💡 Tip: Use this calculator to find the real value of money across years — a must for long-term plans like
retirement savings, college costs, or comparing home values over time.
How the Inflation Calculator Works
- Enter any amount in U.S. dollars (u.s., $1,000).
- Select From Year → To Year between 1913 and 2026.
- Click Calculate to see the inflation-adjusted value based on official CPI-U data.
- To reverse the direction (today → past), check “Treat amount as today”.
📘 Note: CPI data from 1913–2025 is historical. The 2026 value is a prudent projection based on current inflation trends and BLS forecasts, and will be updated after official releases.
Example — $100,000 in 1940 vs 2025 (Real Buying Power)
- Amount: $100,000
- From year: 1940
- To year: 2025
- Direction: then → now
Result snapshot:
• Value in 2025: $2,299,285.71
• Overall change: +2,199.29%
• Multiplier: ×22.993
• Years: 85 • Average annual inflation (CAGR): 3.76%
• CPI 1940: 14.0 | CPI 2025: 321.9
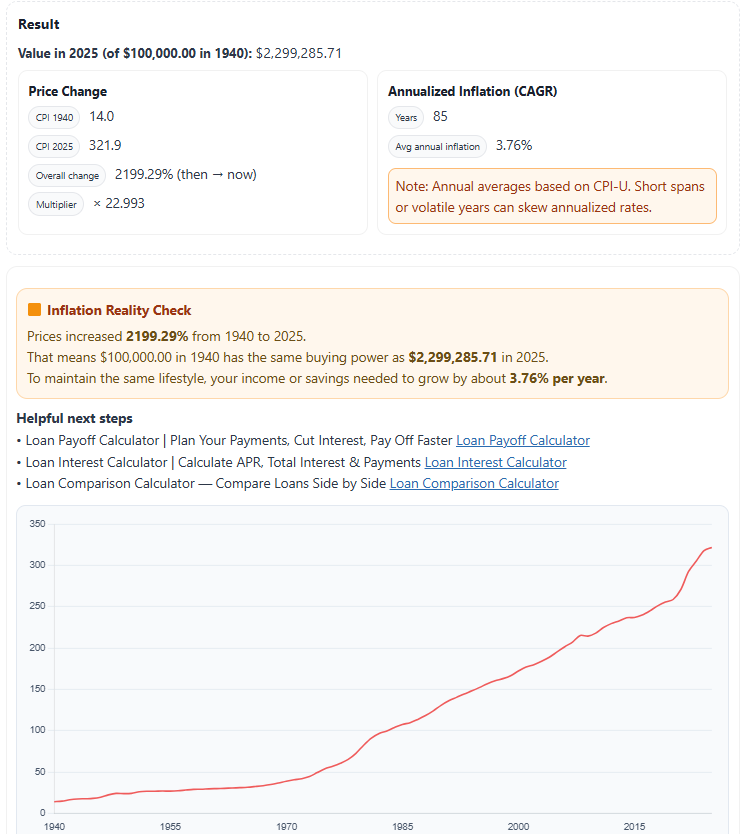
Over 85 years, U.S. prices have increased nearly 23×. In other words, $100,000 in 1940 has the same buying
power as $2.3 million in 2025. That long-term rise — an average of 3.76% inflation per year —
shows why adjusting investments and savings for inflation is essential when comparing money across decades.
Inflation Formula Explained
The inflation rate tells how much prices have increased between two time periods, based on the Consumer Price Index (CPI).
Here’s the standard formula used by economists and the U.S. Bureau of Labor Statistics (BLS):
Inflation Rate (%) =
(CPInew − CPIold) ÷ CPIold × 100
Example:
CPI in 1913 = 9.9
CPI in 2026 = 329.3
→ Inflation ≈ 3,225% increase, averaging about 3.1% per year over 113 years.
U.S. Inflation by Year – CPI Historical Table (1913–2026)
The table below highlights key CPI milestones from 1913 through 2026, showing how consumer prices evolved across major economic eras — from pre-WWII lows to post-pandemic inflation peaks.
| Year | CPI | Inflation (%) |
|---|---|---|
| 1913 | 9.9 | — |
| 1920 | 20.0 | 15.6 |
| 1940 | 14.0 | 0.7 |
| 1970 | 38.8 | 5.8 |
| 1990 | 130.7 | 5.4 |
| 2010 | 218.1 | 1.6 |
| 2020 | 258.8 | 1.2 |
| 2026* | 329.3 | 3.9 (projected) |
📊 Source: U.S. Bureau of Labor Statistics (CPI-U, All Urban Consumers)
inflation calculator – Real-World Impact
If you had $100,000 in 1970, it would take approximately $848,711 in 2026 to match the same purchasing power.
That’s a massive 748.7% increase in consumer prices over 56 years — an average annual inflation rate of 3.89%
according to official CPI data.
⚠️ Inflation Reality Check:
Long-term price growth shows why tracking the real value of money with an accurate
inflation calculator is essential. To preserve your purchasing power, your income and investments
should grow at least as fast as the long-term inflation average.
FAQs
1. What years does this Inflation Calculator cover?
It covers 1913 through 2026. Data from 1913–2025 is historical CPI-U; 2026 is a prudent projection that will be updated once official figures are released.
2. How accurate are 2026 inflation estimates?
The 2026 value is an estimate based on current inflation trends and recent CPI trajectories. It’s useful for planning, and we’ll replace it with the official CPI once the BLS publishes 2026 data.
3. What data source does it use?
The calculator uses the U.S. Bureau of Labor Statistics (BLS) CPI-U (Consumer Price Index for All Urban Consumers), the standard benchmark for measuring consumer price changes in the U.S.
4. How do I calculate inflation manually?
Use: (CPInew − CPIold) ÷ CPIold × 100.
Example: if CPI rises from 100 to 130, inflation = (130−100)÷100×100 = 30%.
5. What was the average inflation rate since 1913?
Over the long run, the U.S. has averaged roughly ~3.1% per year (CPI-U), with higher spikes in the 1970s and early 2020s, and lower periods in the 1950s, 2010s, and early 2020s.
Conclusion + Official Resources
Inflation tells the true story of how the value of money changes over time. By using this
Inflation Calculator, you can measure the real purchasing power of your savings, salary, or loan amount —
from past to present, or even project it into the near future. Understanding inflation helps you make smarter
financial decisions and prepare for long-term goals.
🔗 For accurate and up-to-date inflation data, visit official U.S. government resources:
U.S. Bureau of Labor Statistics – Consumer Price Index (CPI-U)
Federal Reserve – Monetary Policy and Inflation Trends
U.S. Bureau of Economic Analysis – Inflation & Price Indexes
💡 Tip: Always rely on verified sources like the BLS and Federal Reserve for official CPI data and inflation forecasts.